2019-01-01
PREVENT’s Innovative Approach to Threat Prevention
Terrorism and other threats to domestic and international peace can appear almost anywhere in the world today. When acts of aggression occur, post-forensic analyses are conducted to determine cause, methods and associated patterns, providing the data to avoid similar events in the future.
Nonetheless, adversaries are creative in improvising and creating new tactics, requiring a proactive and predictive capability to detect threat activities in advance. Where anomalous behaviour is detected as an indicator or predictor of hostile activities, alerts can be generated in real time as Raytheon has done with the development of an analytical tool, PRoactiVE emergiNg Threat Detection (PREVENT).
Based on the assessment by a dynamic network of unusual patterns or behaviours, PREVENT detects emergent threat behaviour in real time, providing operators with the early warnings they will use to conduct further analysis of the participants identified. PREVENT is thus a general behaviour analysis capability for many environments, including cyber/computer networks, oil rig operations, air traffic and littoral activities.

Figure 1 gives a functional block diagram of PREVENT’S operation through the collection, correlation and categorisation of events from multiple data sources, each corresponding to an agent (“who”), event type (“what”) and event time (“when”). Once received and processed, a stochastic network is formed of sparse super nodes shown as large ellipses with dense local nodes contained within.
Events in the network are represented by lines or connections (called edges) between the nodes. As agents interact over time, connections are made or broken which increase or decrease in strength with the number of events the agents have in common, shown by the thickness (or weight) of the edges between the two nodes.
Sets of densely connected nodes in the network are modelled as a super node representing the events and agents associated with one type of data source. The sparse connectivity between super nodes reflects the relationship of events/agents between the various data sources.
If, for example, one data source provides computer network activities and another telephone network activities, then one super node corresponds to computer network events and the others to telephone network events. The nodes within each super node then correspond to agents (people) using the computer and telephone network.
When several computers exchange data, the IP address (and associated user) of each computer is represented by a node within that super-node, while connections (edges) are made between them reflecting the specific data exchanges. Similarly, in the telephone network super node each phone device (and associated person) constitutes a node and any calls between these phones are reflected in the edges between them.
If a node in the computer network calls a phone in the telephone network via a voice-over IP (VOIP) call or text message, then a connection is made between these two super nodes. PREVENT learns the network structure here thanks to the different data sources and events available.
PREVENT also estimates the stability of the network’s current state periodically by summarising key statistics about each active agent, such as configuration (the number and type of participating events), event duration and connections within the super node and between other super nodes. The difference between current and previous empirical distributions of network activity is computed and if the magnitude of this difference is above a specified threshold, then PREVENT generates associated alert(s) to the operator/analyst.
Further specific monitoring can be started with this information and the additional data sources or sensors activated, with an appropriate course of action correspondingly initiated to stop further threats or harmful activity. The network stability calculation and alert thresholds are configured based on the specific environment and events being monitored.
.jpg)
Swarming Boat Use Case
PREVENT’s capabilities are readily demonstrated in the swarming boats scenario shown in Figure 2, where a strait with both fishing areas and shipping lanes is populated by different types of vessels, including: cargo ships navigating through the strait via one of two shipping lanes; four groups of fishing boats in green circular formations; military vessels in the shipping lane moving faster than the cargo ships; and twelve small fast boats disguised as a pleasure craft, manned by persons (agents) ultimately planning to take aggressive action against the military vessels. The fast boats then enter each fishing area and stop among the fishing boats where they wait before setting an intercept course for the military vessels.
PREVENT’s data source here are events created from vehicle tracks received from multiple radar sensors provided by Raytheon’s Intersect Sentry product, which generates events from the tracks using different analytics such as proximity, heading changes, speeds above and below limits, acceleration and deceleration. As a comprehensive activity-based intelligence (ABI) analytics and automation solution, Intersect Sentrythen provides real-time, automated decision support capabilities, helping analysts identify the most relevant information from huge streams of multi-INT data.
.jpg)
PREVENT processes the events and the associated agents (vessels) to form the stochastic network for detecting anomalous behaviour. Figure 3 plots the network stability metric computed by PREVENT here, with the instability seen to rise above the threshold whenever there is anomalous behaviour of fast-moving craft, such as travelling between fishing clusters, initial swarming toward the shipping lane and, finally, convergence on a target.
Although the instability is above the threshold at the beginning (before 1000 seconds have elapsed), PREVENT ignores the detections because the network is still being formed. After the network matures, PREVENT acts on every detection by generating alerts to the operator.
Oil Drilling Case
PREVENT has been demonstrated on real-world data for drilling; in
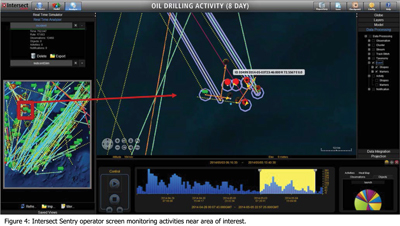
Figure 4 an Intersect Sentry operator screen monitors an offshore area of interest with ongoing oil operations. Again, Sentry™ extracts events analytics from real-time track data such as loitering, immediate proximity and immediate proximity exit.
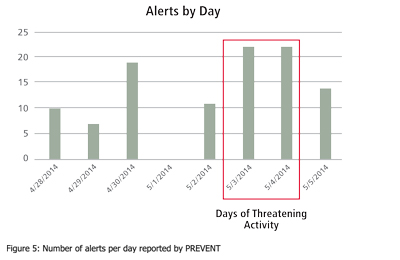
In this longer scenario, PREVENT uses the events and associated agents (or actors) to learn the network, then computes the instability metric over days of detecting and reporting anomalous behaviour. Figure 5 shows the number of alerts per day reported by PREVENT where the anomalous behaviour corresponds to an adversary’s craft steaming to join the drilling activity. The increase in reported alerts here is associated with the Identified ship (ID 33499), a driver of network instability that joins the drilling activity over five separate alerts and matches the findings for that time period, shown in the central zoomed scenario area of the operators screen in Figure 4.
With an architecture designed to scale, PREVENT has been integrated with Docker and Raytheon Space and Airborne Systems’ (SAS) Adaptive Technique Manager (ATM), enabling its distribution across multiple systems with computational parallelisation of events and stochastic network learning. SAS ATM is an event-driven workflow manager for performing man-in-the-loop and fully automated missions, consisting of a web interface, sensor adapters, event processors and a technique manager.
Sensor adapters receive data from different sensors or data sources and convert the data into streaming events. The event processor receives these events from the sensor adapter and generates events analytics used by PREVENT to learn the stochastic network model.
Docker is a lightweight, open, scalable and secure commercial tool accelerating software development, eliminating environmental inconsistencies and distributing shared contents or application across multiple platforms. PREVENT can be scaled to environments with millions of events and tens of thousands of actors when integrated with ATM and Docker.
As a real-time proactive analytics tool, PREVENT is able to process the data and arrive at the anomalous event in less than a minute on a laptop computer, even for the 840 actors and 60,000 events of the oil drilling scenario in Figure 4. Future work includes integrating PREVENT as part of Raytheon SAS’s Cyber Electro Magnetic Battle Management (CEMBM) product for predictive analytics and detecting the behaviour of adversaries across the anomalous spectrum, where Electronic Warfare Officers can manoeuvre and counter adversarial attempts to deny spectrum to U.S. military forces.
To summarise, PREVENT is a novel approach for detecting emergent threat behaviour through the modelling of events and actors as a dynamic stochastic network. It utilises an unsupervised learning approach for real-time proactive analytics, modelling new domains easily by defining a new set of associated actors and events.
PREVENT’s forensic capability allows learned configurations to be stored as a sequence with associated time stamps and later analysed to determine associations between actors, events and activities. Hence, PREVENT is an important analytic tool for Raytheon and its customers, providing a capability to thwart harmful events and save lives.
Credit: Shubha Kadambe, Ph.D.Raytheon Space and Airborne Systems
Reference Text/ Photo:www.raytheon.com,www.ge.com


No Comments